Monday, April 4, 2016

Find the abbreviations in word

To Find the abbreviations in the document,
Go to find, advanced, more and then set search options to "Use wildcards".
Find the following:
<[A-Z]{2,}>
Do find a reading highlight, and then highlight all.

Minus sign is another issue
SymbolUnicode
hyphen
minus sign
N-dash
M-dash
–
−
–
—
f-f
f−f
f–f
f—f
002D or 2010
2212
2013
2014

Tuesday, March 1, 2016

Plotyy equivalent of Bar and scatter plots

It was not so easy to replace the plotyy code with the following:
The idea is simple: plot bars, hold on and then plot scatter.
The problems were axes limits and labels not alignting properly.

% Create figure
close all
figure1 = cfigure(30,10);

% Create axes
axes1 = axes('Parent',figure1, 'YTick',[0 1 2 3]);%,...

 xlim(axes1,[min(dvec_d) max(dvec_d)]);

%  Uncomment the following line to preserve the Y-limits of the axes
ylim(axes1,[0 3]);
box(axes1,'on');
hold(axes1,'on');

% Create ylabel
ylabel('PWV (cm)','FontSize',14);


% Create axes
axes2 = axes('Parent',figure1,'HitTest','off','Color','none',...
   'YTick',[0.94 0.96 0.98 1],...
    'YAxisLocation','right', 'XTick',linspace(min(dvec_d) , max(dvec_d) , 24));
 xlim(axes2,[min(dvec_d) max(dvec_d)]);
 ylim(axes2,[0.94 1]);
hold(axes2,'on');

% Create ylabel
ylabel('MOD21 \epsilon_{29}','FontSize',14);

% Create bar
 bar(dvec_d,pwv_d5,'FaceColor',[0.8 0.8 0.5],'EdgeColor',[0.5 0.99 0.9],'Parent',axes1);
 %set(axes1, 'ydir', 'reverse'); % this will put hanging bars


set(axes1,'xtick',[])
set(axes1,'xticklabel',[])
hold on
% Create scatter
scatter(dvec_d,mod21_e295d, 'Parent',axes2,'MarkerEdgeColor',[1 0 0],'Marker','*');
set(axes2,'xtick',[])
set(axes2,'xticklabel',[])

%         datetick('x','yyyy-mm' );.
datetick('x','yyyy-mm', 'keeplimits')
title(' PWV and Emissivity Time Series','FontSize',14); % add a title and define the font size
xlabel('Time ( 2003-2005)')
hold on
line( dvec_d, 1.5* ones(length(dvec_d)), 'Parent', axes1  )

set(axes2,{'ycolor'},{'r' })  
    

Wednesday, February 24, 2016

States Line disappearing in map: Solved

In matlab you can extract the states lat/lon information and plot them so that the problem of states lines disappearing can be solved.
here is an example where you can extract the state lat/lon data from the axis limit boundary and make lats/lons variables. These can be plotted with geoshow.

figure(1)
latlim = [35 45];
lonlim = [-115 -100];
    ax = worldmap(latlim, lonlim);

  states = shaperead('usastatehi','UseGeoCoords', true, 'BoundingBox', [lonlim', latlim']);
   geoshow(ax, states, 'FaceColor', [1 1 1], 'LineWidth', 3);
   lats = [];
lons = [];
for aa = 1:length(states)
lats = horzcat(lats, states(aa).Lat);
lons = horzcat(lons, states(aa).Lon);
end
geoshow(lats,lons,'DisplayType','Line', 'Color', [0 1 0])
% latlim=[floor(min(min(SatLat))),ceil(max(max(SatLat)))];
% lonlim=[floor(min(min(SatLon))),ceil(max(max(SatLon)))];
surfacem(SatLat, SatLon, double(c66in5));
hold on
plotm( y,x ) % polygon

plotm(37 , -105 , 1, 'yo')
set(gcf,'Color','white')

Thursday, February 18, 2016

Latex Installed on Windows 10

MiKTeX installed the Latex.exe in the following location:
Not so obvious, Is it?
C:\Users\myusername\AppData\Local\Programs\MiKTeX 2.9\miktex\bin\x64

Wednesday, February 10, 2016

Insert Landscape pages in paper

We are often faced with a long table in the middle of the document. I used to insert a text box, then ratate it so that final view had a rotated table. However, when I went on to edit the table/text box content, it would rotate back... and things are not so easy!

This solution is easier than what I used to do:
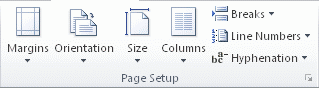
Simply highlight the text/table to be rotated into the landscape, then go to margin, select custom, then do landscape page orientation for the selection. Voila! I am assuming that the table will occupy the whole page.

The following is from Office Support page:
https://support.office.com/en-us/article/Rotate-page-orientation-between-portrait-and-landscape-in-Word-2010-14952283-8BA7-4A52-82B9-A8487A5674B4

Use portrait and landscape orientation in the same document

  1. Select the pages or paragraphs that you want to change to portrait or landscape orientation.
    NOTE    If you select some but not all of the text on a page to change to portrait or landscape orientation, Word places the selected text on its own page, and the surrounding text on separate pages.
  2. On the Page Layout tab, in the Page Setup group, click Margins.
    page setup group
  3. Click Custom Margins.
  4. On the Margins tab, click Portrait or Landscape.
  5. In the Apply to list, click Selected text..

Tuesday, February 2, 2016

Matlab Map plot with limits

It is not so obvious to plot matlab maps with latitude and longitude limits on the axes' ends.
The following code helped me.
figure
ax = worldmap(ylim, xlim);
states = shaperead('usastatehi','UseGeoCoords', true, 'BoundingBox', [xlim', ylim']);
geoshow(ax, states, 'FaceColor', [1 1 1]);
surfacem(LatLsatf1, LonLsatf1,NDVI1);
colormap('summer')
title(['NDVI (', DOY, ')'], 'FontSize', 20)
map2 = (colormap);
map2 = flipud(map2);
colormap(map2);
cmap = colormap; % cmap nicely puts colormap into 3 col data
% colorbar
caxis([-0  1])

setm(gca,'fontsize', 12,'PLabelLocation',[ylim(1), mean(ylim), ylim(2)],'PLineLocation',[ylim(1), mean(ylim), ylim(2)],...
    'PLabelRound',-3,'MLabelLocation',[xlim(1), mean(xlim), xlim(2)],'MLineLocation',[xlim(1), mean(xlim), xlim(2)], 'MLabelRound',-3, ...
     'Grid','on')