Showing posts with label matlab. Show all posts

Friday, July 21, 2017

Plot USA m_maps

(cc).
  close all
 load coastlines
states = shaperead('usastatehi',...
        'UseGeoCoords', true, 'BoundingBox', [lonlim', latlim']);
figure
m_proj('miller','long',[-125 -67],'lat',[25 49.5]);
% m_gshhs_i('color','b');
% m_grid('box','fancy','tickdir','in');
m_coord('geographic');           % Switch to assuming geographic
% m_coast('patch',[1 1 0.99],'edgecolor','b');
  m_coast('patch',[.98 0.98 .98],'edgecolor','none');
    m_grid('box','fancy','linestyle','none','backcolor',[.8 .96 1]);
m_text(-121,38.08,  '*' ,'color','r','fontweight','bold','fontsize',24); % Tahoe
m_text(-116.8,33.03,  '*' ,'color','r','fontweight','bold','fontsize',24); % salton Sea

m_text( -77.8729,40.2547,  '*' ,'color','r','fontweight','bold','fontsize',24); % PSU
m_text( -89.9729,33.9,  '*' ,'color','r','fontweight','bold','fontsize',24); % GWN
m_text(-97.62,43.3,  '*' ,'color','r','fontweight','bold','fontsize',24); % SXF
m_text(-89.37,40.,  '*' ,'color','r','fontweight','bold','fontsize',24); % BND

for kk = 1:length(states)
m_line(states(kk).Lon,states(kk).Lat,'linewi',0.5,'color',[200 200 200]./255);
end
set(gcf,'Color','White')

export_fig([ saveDir,  'USA_validationPoints'],'-png','-r250')

Monday, June 13, 2016

Matlab Colorbar: LST

I think I found a good one! (Sorry intensity, no one prints grayscale pics these days... they just read on-screen).
r1 = [1 0];
g1 = [0 0];
b1 =  [1 1];
rgb1 = [r1; g1; b1]';
rgba = interp1([1 2],rgb1, linspace(1,2,16 ));
r1 = [0 0];
g1 = [0 1];
b1 =  [1 1];
rgb1 = [r1; g1; b1]';
rgbb = interp1([1 2],rgb1, linspace(1,2,11 ));

r1 = [0 0];
g1 = [1 1];
b1 =  [1 0];
rgb1 = [r1; g1; b1]';
rgbc = interp1([1 2],rgb1, linspace(1,2,10));

r1 = [0 1];
g1 = [1 1];
b1 =  [0 0];
rgb1 = [r1; g1; b1]';
rgbd = interp1([1 2],rgb1, linspace(1,2,11 ));

r1 = [ 1 1];
g1 = [1 0];
b1 =  [0 0];
rgb2 = [r1; g1; b1]';
rgbe= interp1([1 2],rgb2, linspace(1,2,16));

newNDVI = [rgba;rgbb;rgbc;rgbd;rgbe];

newNDVI= interp1( newNDVI, linspace(1,64,256));


%
figure
plot([1:256],newNDVI(:,1), 'ro-'); hold on
plot([1:256],newNDVI(:,2), 'g*-');
plot([1:256],newNDVI(:,3), 'bd-.');
xlim([1 256])

colormap(newNDVI );
cmap = colormap; % cmap nicely puts colormap into 3 col data
% colorbar
caxis([0 1])
hc = colorbar('southoutside');
set(hc, 'FontSize', 16)

 axis off; set(gcf,'Color','White')


I can append white and or black at the end for distinction, if needed.

Friday, May 27, 2016

Forcing Matlab colorbar to display climits

Matlab sometimes can not register the upper and lower limits of the color bar when the figures are saved (eg with export_fig). 

I found a way around it:
instead of setting caxis limit at the exact values, increase/decrease the upper/lower limit
caxis([0.94 0.99] )
to >> caxis([0.94 0.99001] )

This worked for me!


Thursday, May 5, 2016

Colormap Stark #matlab colorbar

I wanted to have a colormap which had a great degree of contrast, and was not really a rainbow scheme.

I have tried to solve this issue by poking at different colormaps
http://usefulcodes.blogspot.com/2015/06/colormap-hotjet.html
(very close, but keeps the rainbow defect flat intensity for the large part in the middle.)
http://usefulcodes.blogspot.com/2015/06/colormap-goofy-matlab.html
(looks green and goofy! Did not like it.)
http://usefulcodes.blogspot.com/2015/06/matlab-colormap-rose.html
(has nice monotonic intensity gradient, but not that beautiful on maps.)
See the examples: http://usefulcodes.blogspot.com/search/label/colormap
I present you a new one! Colormap "stark".
This does have the defect of not linearly increasing the intensity, but does not stay flat in the middle. It has two saddles, allowing the left/right contrast. I like it so far.
Well, it is inspired from the LST image from MODIS
http://neo.sci.gsfc.nasa.gov/view.php?datasetId=MOD11C1_M_LSTDA


175 256 255
100 249 255
50 223 253
10 191 252
9 144 252
12 106 255
11 79 254
26 56 254
34 38 255
50 34 255
79 33 255
85 33 255
101 34 255
132 35 255
150 36 255
177 39 255
217 36 255
243 35 255
255 35 213
255 34 175
255 30 143
255 36 110
255 34 88
255 33 65
255 44 35
255 72 35
254 95 39
255 116 45
254 138 41
254 160 46
255 183 45
255 199 46
255 210 47
253 225 47
254 230 75
256 256 110
R G B


newN = 1:64;

isn = floor(linspace(1,64,36));
%RGB = [R G B];
R1 = RGB(:,1);
G1 = RGB(:,2);
B1 = RGB(:,3);

Rn = runmean(interp1(isn, R1, newN),2);
Gn = runmean(interp1(isn, G1, newN),2);
Bn = runmean(interp1(isn, B1, newN),2);

newC=  [Rn', Gn', Bn']./256;


close all
figure ;
plot(newN, Rn, 'r-')
hold on
plot(newN, Gn, 'G-')
plot(newN, Bn, 'b-')
colormap(newC);
colorbar('southoutside')
ylim([0 260])
xlim([1 64])
legend('R', 'G', 'B','Location','southoutside','Orientation','horizontal')
xlabel('C-index')
ylabel('R,G,B')
export_fig([ 'RGB-colormap'   ],'-jpeg','-r250')

figure;
plot(newN, sum(newC,2)./3, 'r-')
ylabel('Intensity')
xlabel('C-index')
xlim([1 64])
export_fig([ 'RGB-intensity' ],'-jpeg','-r250')

Here is an alternate
175 256 255
100 249 255
50 223 253
10 191 252
9 144 252
12 106 255
11 79 254
26 56 254
34 38 255
50 25 255
79 15 255
85 15 255
101 30 255
132 50 255
150 70 255
177 80 255
217 100 255
243 100 255
255 80 213
255 70 175
255 50 143
255 30 110
255 15 88
255 25 65
255 44 35
255 72 35
254 95 39
255 116 45
254 138 41
254 160 46
255 183 45
255 199 46
255 225 47
253 240 47
254 250 75
256 256 129
R G B

It adds whiteness in the middle, creating W shaped swing to the green pallets.


Thursday, April 21, 2016

M_Map Examples for matlab mapping

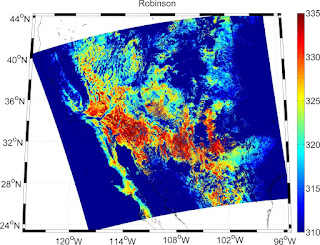
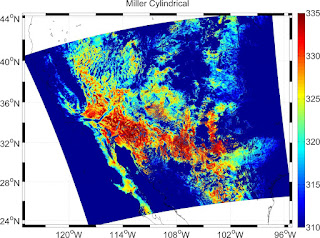
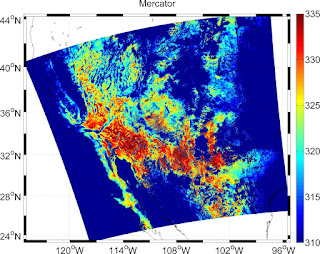
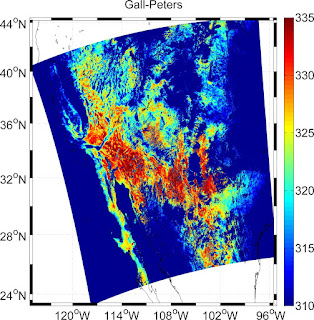
There are so many projections to choose from:
%      Stereographic
%      Orthographic
%      Azimuthal Equal-area
%      Azimuthal Equidistant
%      Gnomonic
%      Satellite
%      Albers Equal-Area Conic
%      Lambert Conformal Conic
%      Mercator
%      Miller Cylindrical
%      Equidistant Cylindrical
%      Oblique Mercator
%      Transverse Mercator
%      Sinusoidal
%      Gall-Peters
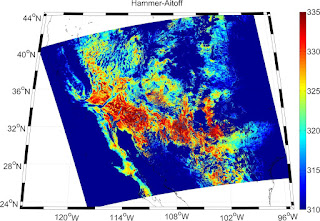
%      Hammer-Aitoff
%      Mollweide
%      Robinson
%      UTM
Which one to choose?
Let me quote: "Well, it depends really on how large an area you are mapping. Usually, maps of the whole world are Mercator, although often the Miller Cylindrical projection looks better because it doesn't emphasize the polar areas as much. Another choice is the Hammer-Aitoff or Mollweide (which has meridians curving together near the poles). Both are equal-area. It's probably not a good idea to use these projections for maps that don't have the equator somewhere near the middle. The Robinson projection is not equal-area or conformal, but was the choice of National Geographic (for a while, anyway), and also appears in the IPCC reports.If you are plotting something with a large north/south extent, but not very wide (say, North and South America, or the North and South Atlantic), then the Sinusoidal or Mollweide projections will look pretty good. Another choice is the Transverse Mercator, although that is usually used only for very large-scale maps.
For smaller areas within one hemisphere or other (say, Australia, the United States, the Mediterranean, the North Atlantic) you might pick a conic projection. The differences between the two available conic projections are subtle, and if you don't know much about projections it probably won't make much difference which one you use.
If you get smaller than that, it doesn't matter a whole lot which projection you use. One projection I find useful in many cases is the Oblique Mercator, since you can align it along a long (but narrow) coastal area. If map limits along lines of longitude/latitude are OK, use a Transverse Mercator or Conic Projection. The UTM projection is also useful.
Polar areas are traditionally mapped using a Stereographic projection, since for some reason it looks nice to have a "bullseye" pattern of latitude lines."
https://www.eoas.ubc.ca/~rich/private/mapug.html#p2.5

Here are some of my favs:

latlim=[ (min(min(Lat11))), (max(max(Lat11)))];
lonlim=[ (min(min(Lon11))), (max(max(Lon11)))];figure(1)
% m_proj('UTM','long',lonlim,'lat',latlim);
% m_proj('Miller Cylindrical','long',lonlim,'lat',latlim);
% m_proj('Albers Equal-Area Conic','long',lonlim,'lat',latlim);
m_proj('Robinson','long',lonlim,'lat',latlim);
% m_proj('Sinusoidal','long',lonlim,'lat',latlim);

m_pcolor(Lon11,Lat11,LST11);
set(gca,'Fontsize',24)
shading interp
m_gshhs_i('color','k');
m_grid('linestyle','-.','box','fancy','tickdir','in' );
caxis([310 335])
colorbar
set(gcf,'Color','White')
title('Robinson')
set(gca,'Fontsize',24)

Some examples of the projected MODIS LST data


Native: examples
https://www.eoas.ubc.ca/~rich/map.html

Wednesday, April 20, 2016

Matlab Plot Latitude and Longitude with degree symbol on the axis label

Not the complete code, but it does the job.
close all
load coast
cfigure( 40, 20);
plot(long, lat, 'k')
grid on
% s = sprintf('45%c', char(176));

set(gca,'XLim',[-180 180])
set(gca,'YLim',[-180/2 180/2])
set(gca,'XTick',[-180:40: 180])
set(gca,'YTick',[-90:30: 90])

xt=get(gca,'xtick');
for k=1:numel(xt);
xt1{k}=sprintf('%d°',xt(k));
end
set(gca,'xticklabel',xt1);

xt=get(gca,'ytick');
for k=1:numel(xt);
xt1{k}=sprintf('%d°',xt(k));
end
set(gca,'yticklabel',xt1);

set(gca,'Fontsize',26)

annotation('textbox', [.15  .232 0.16  0.1 ],'EdgeColor',[ 0 0 0] )

% xlim([-180 180])
% ylim([-90 90])
hold on
plot(longitude(dayyes==0), latitude(dayyes==0), 'o', 'MarkerEdgeColor','b','MarkerSize',5);
plot(longitude(dayyes==1),latitude(dayyes==1), '*', 'MarkerEdgeColor','r','MarkerSize',6);
text(-167,-50,  sprintf('* Day Profile  ' ), 'color', 'r', 'FontSize', 26)
text(-167,-60,  sprintf('o Night Profile' ), 'color', 'b', 'FontSize', 26)
%    annotation('textbox', [-175  -55 20  15 ],'EdgeColor',[0 0 0] )
ylabel('Latitude ', 'FontSize', 26)
xlabel('Longitude ', 'FontSize', 26)
set(gcf,'Color','white')

Tuesday, March 1, 2016

Plotyy equivalent of Bar and scatter plots

It was not so easy to replace the plotyy code with the following:
The idea is simple: plot bars, hold on and then plot scatter.
The problems were axes limits and labels not alignting properly.

% Create figure
close all
figure1 = cfigure(30,10);

% Create axes
axes1 = axes('Parent',figure1, 'YTick',[0 1 2 3]);%,...

 xlim(axes1,[min(dvec_d) max(dvec_d)]);

%  Uncomment the following line to preserve the Y-limits of the axes
ylim(axes1,[0 3]);
box(axes1,'on');
hold(axes1,'on');

% Create ylabel
ylabel('PWV (cm)','FontSize',14);


% Create axes
axes2 = axes('Parent',figure1,'HitTest','off','Color','none',...
   'YTick',[0.94 0.96 0.98 1],...
    'YAxisLocation','right', 'XTick',linspace(min(dvec_d) , max(dvec_d) , 24));
 xlim(axes2,[min(dvec_d) max(dvec_d)]);
 ylim(axes2,[0.94 1]);
hold(axes2,'on');

% Create ylabel
ylabel('MOD21 \epsilon_{29}','FontSize',14);

% Create bar
 bar(dvec_d,pwv_d5,'FaceColor',[0.8 0.8 0.5],'EdgeColor',[0.5 0.99 0.9],'Parent',axes1);
 %set(axes1, 'ydir', 'reverse'); % this will put hanging bars


set(axes1,'xtick',[])
set(axes1,'xticklabel',[])
hold on
% Create scatter
scatter(dvec_d,mod21_e295d, 'Parent',axes2,'MarkerEdgeColor',[1 0 0],'Marker','*');
set(axes2,'xtick',[])
set(axes2,'xticklabel',[])

%         datetick('x','yyyy-mm' );.
datetick('x','yyyy-mm', 'keeplimits')
title(' PWV and Emissivity Time Series','FontSize',14); % add a title and define the font size
xlabel('Time ( 2003-2005)')
hold on
line( dvec_d, 1.5* ones(length(dvec_d)), 'Parent', axes1  )

set(axes2,{'ycolor'},{'r' })  
    

Wednesday, February 24, 2016

States Line disappearing in map: Solved

In matlab you can extract the states lat/lon information and plot them so that the problem of states lines disappearing can be solved.
here is an example where you can extract the state lat/lon data from the axis limit boundary and make lats/lons variables. These can be plotted with geoshow.

figure(1)
latlim = [35 45];
lonlim = [-115 -100];
    ax = worldmap(latlim, lonlim);

  states = shaperead('usastatehi','UseGeoCoords', true, 'BoundingBox', [lonlim', latlim']);
   geoshow(ax, states, 'FaceColor', [1 1 1], 'LineWidth', 3);
   lats = [];
lons = [];
for aa = 1:length(states)
lats = horzcat(lats, states(aa).Lat);
lons = horzcat(lons, states(aa).Lon);
end
geoshow(lats,lons,'DisplayType','Line', 'Color', [0 1 0])
% latlim=[floor(min(min(SatLat))),ceil(max(max(SatLat)))];
% lonlim=[floor(min(min(SatLon))),ceil(max(max(SatLon)))];
surfacem(SatLat, SatLon, double(c66in5));
hold on
plotm( y,x ) % polygon

plotm(37 , -105 , 1, 'yo')
set(gcf,'Color','white')

Tuesday, February 2, 2016

Matlab Map plot with limits

It is not so obvious to plot matlab maps with latitude and longitude limits on the axes' ends.
The following code helped me.
figure
ax = worldmap(ylim, xlim);
states = shaperead('usastatehi','UseGeoCoords', true, 'BoundingBox', [xlim', ylim']);
geoshow(ax, states, 'FaceColor', [1 1 1]);
surfacem(LatLsatf1, LonLsatf1,NDVI1);
colormap('summer')
title(['NDVI (', DOY, ')'], 'FontSize', 20)
map2 = (colormap);
map2 = flipud(map2);
colormap(map2);
cmap = colormap; % cmap nicely puts colormap into 3 col data
% colorbar
caxis([-0  1])

setm(gca,'fontsize', 12,'PLabelLocation',[ylim(1), mean(ylim), ylim(2)],'PLineLocation',[ylim(1), mean(ylim), ylim(2)],...
    'PLabelRound',-3,'MLabelLocation',[xlim(1), mean(xlim), xlim(2)],'MLineLocation',[xlim(1), mean(xlim), xlim(2)], 'MLabelRound',-3, ...
     'Grid','on')

Tuesday, December 29, 2015

Too many outputs requested. Most likely cause is missing []

This is one of the weirdest error I saw in matlab.
"Too many outputs requested. Most likely cause is missing [] around left hand side that has a comma separated list expansion."
In my case, this was caused by the following sequence of operations:
I was extracting name from a dir object. The dir returned an empty output. This caused the query in the for loop to return void. Obviously, "too many outputs requested" from a zero size variable.

Thursday, September 10, 2015

Plot Clouds as white pix

Plot Clouds
figure;
c95copy = double(c95)+1;
imagesc(c95copy);
icol = colormap;
icol(64,:) = [1 1 1];
colormap(icol)

Monday, July 27, 2015

For Imagesc, plot water/nan with different color

Figure plot with the lowest value set as distinct colormap.
 figure; imagesc(Temperature)

icol =  colormap;
icol(1,:) = [0 0 0]; % or 111 for white
colormap(icol);

Tuesday, June 23, 2015

Colormap goofy #matlab

Well, this does not look as good as the rainbow, but does have the increasing intensity, and some degree of nice variation in rgb. I have previously proposed a new colormap "hotjet". However the nice colormap in "hotjet" did not have the increasing intensity.

It was a bit hard to come up with the numbers. So, I simply superimposed the green and blue colors modeled as the sine and cosine waves so that they complement each other. Meanwhile, I added a gradient to the red color from 10 to 54. That helped to increase the color intensity even though the sine and cosine were simply summed to 1.
Figure below shows the colorscheme for the RGB components. I had to fiddle the numbers on the first and last 10 bins because I wanted the "outliers" to have some respected colors.
Please allow me to call it goofy as it has green-goofy color at the center. I really miss the yellow and cyan from jet.

Components of Goofy. The liner trend in r helps increase the intensity.

r g b sum
1 0.000 0.000 0.200 0.200
2 0.000 0.000 0.400 0.400
3 0.000 0.000 0.600 0.600
4 0.000 0.000 0.750 0.750
5 0.000 0.000 0.813 0.813
6 0.000 0.000 0.850 0.850
7 0.000 0.000 0.938 0.938
8 0.000 0.000 0.950 0.950
9 0.000 0.000 0.980 0.980
10 0.022 0.000 1.000 1.022
11 0.044 0.070 0.930 1.044
12 0.067 0.139 0.861 1.067
13 0.089 0.208 0.792 1.089
14 0.111 0.276 0.724 1.111
15 0.133 0.342 0.658 1.133
16 0.156 0.407 0.593 1.156
17 0.178 0.469 0.531 1.178
18 0.200 0.530 0.470 1.200
19 0.222 0.588 0.412 1.222
20 0.244 0.643 0.357 1.244
21 0.267 0.695 0.305 1.267
22 0.289 0.743 0.257 1.289
23 0.311 0.788 0.212 1.311
24 0.333 0.829 0.171 1.333
25 0.356 0.866 0.134 1.356
26 0.378 0.899 0.101 1.378
27 0.400 0.927 0.073 1.400
28 0.422 0.951 0.049 1.422
29 0.444 0.970 0.030 1.444
30 0.467 0.985 0.015 1.467
31 0.489 0.995 0.005 1.489
32 0.511 0.999 0.001 1.511
33 0.533 0.999 0.001 1.533
34 0.556 0.995 0.005 1.556
35 0.578 0.985 0.015 1.578
36 0.600 0.970 0.030 1.600
37 0.622 0.951 0.049 1.622
38 0.644 0.927 0.073 1.644
39 0.667 0.899 0.101 1.667
40 0.689 0.866 0.134 1.689
41 0.711 0.829 0.171 1.711
42 0.733 0.788 0.212 1.733
43 0.756 0.743 0.257 1.756
44 0.778 0.695 0.305 1.778
45 0.800 0.643 0.357 1.800
46 0.822 0.588 0.412 1.822
47 0.844 0.530 0.470 1.844
48 0.867 0.469 0.531 1.867
49 0.889 0.407 0.593 1.889
50 0.911 0.342 0.658 1.911
51 0.933 0.276 0.724 1.933
52 0.956 0.208 0.792 1.956
53 0.978 0.139 0.861 1.978
54 1.000 0.070 0.930 2.000
55 1.000 0.130 0.960 2.090
56 1.000 0.200 0.970 2.170
57 1.000 0.300 0.980 2.280
58 1.000 0.400 0.900 2.300
59 1.000 0.500 0.813 2.313
60 1.000 0.600 0.850 2.450
61 1.000 0.700 0.938 2.638
62 1.000 0.800 0.950 2.750
63 1.000 0.900 0.980 2.880
64 1.000 1.000 1.000 3.000

Tuesday, June 16, 2015

Save Only Matlab Colorbar as a figure

Could not find a good solution to save the matlab colorbar. One idea was to duplicate the figure, then crop it out. Then I thought may be turning the axis would do the job. It does!
I was able to save it as a jpeg figure.

The following code was tested in Matlab2015a. Use it at your risk.
figure
colormap('parula');
caxis([0.4 0.9]);hc = colorbar;
axis off; set(gcf,'Color','White')
export_fig([savePaperFig, 'ColorBarTrans', obsname],'-jpeg','-r250')

Wednesday, June 10, 2015

Setting/Changing Default Colormap in Matlab

Well, a new version of matlab sets parula as the default colormap. I agree all the arguments against the "rainbow" colormap theme... For example see here...

I would probably change the colormap in the future projects.
However, for my current one, I wanted jet as the default. Here is how I did reset the parula to jet.
>>    set(0,'DefaultFigureColormap',jet)

Thursday, May 7, 2015

List parsing in matlab

List parsing in matlab is not very trivial.
This is an example to find the members of A in B, and vice versa.

The matlab function, ismember does a nice job of set difference between two sets. However, I wanted to access both the elements (because I had data in other col to be matched).

Here is a simple example.

A = {'dog','cat','b','fish'};
B = {'fish','cat','a', 'horse','dog'};
[Lia,Locb] = ismember(A,B)
iA = find(Lia>0)
iB = Locb(Locb>0);

A(iA)
B(iB)

% iB = find(Locb>0)
for jj = 1:length(iA)
    iwantA = iA(jj)
    iwantB = iB(jj)
   
%     in python I could do for i in iA
    A(iwantA)
    B(iwantB)
    '=='
    pause
   
end

Find and remove nan from matlab arrays

Sometimes the matrix has nans on the rows, and we would have to get rid of them before we could do any analysis.
A(any(isnan(A),2),:)=[];

Tuesday, January 13, 2015

Plotyy example #matlab #plot

A simple plotyy command for matlab to plot two data on y axis.
figure;
[ax,h1,h2] = plotyy(date,data1,date,data2);
% AX(2) = [];
set(h1,  'Markerfacecolor','k','Markersize',3)
set(h2, 'Markerfacecolor','b','Markersize',3)
% set(AX,'XAxisLocation','top', 'XTickLabel',[])
datetick('x',12,'keeplimits','keepticks')
set(ax(2),'XAxisLocation','bottom','XTickLabel',[]);
set(h1, 'Marker', 'o', 'LineStyle', 'none', 'MarkerSize', 3);
set(h2, 'Marker', '*', 'LineStyle', 'none', 'MarkerSize', 3);
title(tit);
ylabel(ax(1),'asdf(cm)') % left y-axis
ylabel(ax(2),'ttt') % right y-axis

Friday, December 5, 2014

creating csv with header text in matlab

The csvwrite function in matlab does not work well with the text. There is a table feature in the new matlab version. However, here is a quick way to create csv with text header in matlab

csvData = [Elev TPW SkinT SurfacePr dayyes' ProfType Uyear Umo Uhr latitude longitude];

header=['Elev,TPW,SkinT,SurfacePr,dayyes,ProfType, year, mo,HH, latitude,longitude'];
outid = fopen('SeeBor.csv', 'w+');
fprintf(outid, '%s', header);
fclose(outid);
dlmwrite ('SeeBor.csv',csvData,'roffset',1,'-append')

Thursday, December 4, 2014

Latitude Longitude and Data on Map @matlab

I wanted to have a nice map of the global dataset given the lat/lon and the dataset.
This code is being put here so that it could be used later.
boxmap = 0
% close all

latlim = [-90, 90];
lonlim = [-180, 180];
load coast
figure

if boxmap
    axesm('MapProjection','lambcyln','grid','on', ...
        'MapLatLimit',latlim,'MapLonLimit',lonlim,...
        'MLineLocation',15, 'PLineLocation',15)
else
    ax = worldmap(latlim, lonlim);
 
end
geoshow(lat, long,'Color', 'black' )
set(gcf,'Color','white')

for jj = 1:length(cimms)
   
    [SunRiseSet,Day,Dec,Alt,Azm,Rad] = suncycle( latitude(jj) , longitude(jj) , [Uyear(jj) Umo(jj) Uday(jj)] , 2880 );
 
    if SunRiseSet(2)<SunRiseSet(1)
        SunRiseSet(2) = SunRiseSet(2)+24;
    end
 
    if Uhr(jj)>SunRiseSet(1) & Uhr(jj)<SunRiseSet(2)
        plotm(latitude(jj),longitude(jj), jj,'o', 'MarkerEdgeColor','r','MarkerSize',8);
     
        dayyes(jj) = 1;
    else
        plotm(latitude(jj),longitude(jj), jj,'o', 'MarkerEdgeColor','b','MarkerSize',8);
     
        dayyes(jj) = 0;
     
    end
 
    hold on
 
    if rem(jj,1000)==0
        textm(latitude(jj),longitude(jj),  sprintf('%.1d', jj), 'color', 'g')
     
        pause(0.5)
     
    end
 
 
end