I think I found a good one! (Sorry intensity, no one prints grayscale pics these days... they just read on-screen).
 I can append white and or black at the end for distinction, if needed.
r1 = [1 0];
g1 = [0 0];
b1 = [1 1];
rgb1 = [r1; g1; b1]';
rgba = interp1([1 2],rgb1, linspace(1,2,16 ));
r1 = [0 0];
g1 = [0 1];
b1 = [1 1];
rgb1 = [r1; g1; b1]';
rgbb = interp1([1 2],rgb1, linspace(1,2,11 ));
r1 = [0 0];
g1 = [1 1];
b1 = [1 0];
rgb1 = [r1; g1; b1]';
rgbc = interp1([1 2],rgb1, linspace(1,2,10));
r1 = [0 1];
g1 = [1 1];
b1 = [0 0];
rgb1 = [r1; g1; b1]';
rgbd = interp1([1 2],rgb1, linspace(1,2,11 ));
r1 = [ 1 1];
g1 = [1 0];
b1 = [0 0];
rgb2 = [r1; g1; b1]';
rgbe= interp1([1 2],rgb2, linspace(1,2,16));
newNDVI = [rgba;rgbb;rgbc;rgbd;rgbe];
newNDVI= interp1( newNDVI, linspace(1,64,256));
%
figure
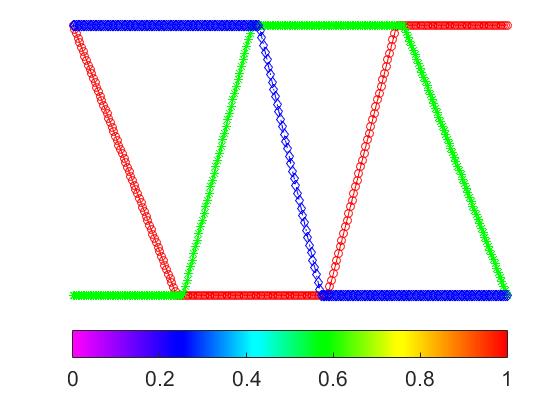
plot([1:256],newNDVI(:,1), 'ro-'); hold on
plot([1:256],newNDVI(:,2), 'g*-');
plot([1:256],newNDVI(:,3), 'bd-.');
xlim([1 256])
colormap(newNDVI );
cmap = colormap; % cmap nicely puts colormap into 3 col data
% colorbar
caxis([0 1])
hc = colorbar('southoutside');
set(hc, 'FontSize', 16)
axis off; set(gcf,'Color','White')
No comments:
Post a Comment