Showing posts with label colormap. Show all posts

Friday, May 27, 2016

Colormap for NDVI

Setting up NDVI colorbar can be tricky! You want a nice representation of the vegetation and bare surfaces in the map.

1. I found an easy way would be to flip the default matlab summer color bar upside down!
colormap('summer')
map2 = (colormap);
map2 = flipud(map2);
colormap(map2);
cmap = colormap;
It looks like:
However, the negatives are not treated nicely. For the first approximation, I could set x<0 == 0.

2. Found a nice one:
https://publiclab.org/notes/cfastie/08-26-2014/new-ndvi-colormap
The colorbar is nice, but, I was not much happy with the squeezed RBG dance!


3. Having seen them, I wanted to create my own.
I combined the inverted summer with the graded b/w scheme.  The idea is to set inverted summer for x > 0 with  the gray image for x < 0!
So, I wrote this small piece!

r1 = [0 1];
g1 = [0 1];
b1 =  [0 1];
rgb1 = [r1; g1; b1]';
rgbt = interp1([1 2],rgb1, linspace(1,2,32 ));

r1 = [ 1 0];
g1 = [1 0.5];
b1 =  [0.4 0.4];
rgb2 = [r1; g1; b1]';
rgbb= interp1([1 2],rgb2, linspace(1,2,32 ));

newNDVI = [rgbt;rgbb];

figure
colormap(newNDVI );
cmap = colormap; % cmap nicely puts colormap into 3 col data
% colorbar
caxis([-1 1])
hc = colorbar('southoutside');
set(hc, 'FontSize', 16)

 axis off; set(gcf,'Color','White')
You can set that linspace limit to 128, and make 256x3 colormap, making a smooth colorbar.
The new NDVI colorbar looks like:

The color scheme looks like:

For the first half, it goes from dark to bright, and then smoothly to green from yellow at the center!

Try it! and let me know if you like this scheme for NDVI!
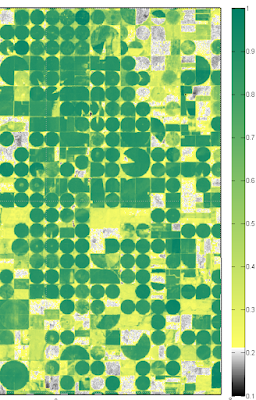
Here is a small preview. I changed the lower rgbb matrix to 224x3 arrays which nicely set yellow limit at ~0.2! (some info on NDVI for the cusious minds: http://earthobservatory.nasa.gov/Features/MeasuringVegetation/measuring_vegetation_2.php)




Thursday, May 5, 2016

Colormap Stark #matlab colorbar

I wanted to have a colormap which had a great degree of contrast, and was not really a rainbow scheme.

I have tried to solve this issue by poking at different colormaps
http://usefulcodes.blogspot.com/2015/06/colormap-hotjet.html
(very close, but keeps the rainbow defect flat intensity for the large part in the middle.)
http://usefulcodes.blogspot.com/2015/06/colormap-goofy-matlab.html
(looks green and goofy! Did not like it.)
http://usefulcodes.blogspot.com/2015/06/matlab-colormap-rose.html
(has nice monotonic intensity gradient, but not that beautiful on maps.)
See the examples: http://usefulcodes.blogspot.com/search/label/colormap
I present you a new one! Colormap "stark".
This does have the defect of not linearly increasing the intensity, but does not stay flat in the middle. It has two saddles, allowing the left/right contrast. I like it so far.
Well, it is inspired from the LST image from MODIS
http://neo.sci.gsfc.nasa.gov/view.php?datasetId=MOD11C1_M_LSTDA


175 256 255
100 249 255
50 223 253
10 191 252
9 144 252
12 106 255
11 79 254
26 56 254
34 38 255
50 34 255
79 33 255
85 33 255
101 34 255
132 35 255
150 36 255
177 39 255
217 36 255
243 35 255
255 35 213
255 34 175
255 30 143
255 36 110
255 34 88
255 33 65
255 44 35
255 72 35
254 95 39
255 116 45
254 138 41
254 160 46
255 183 45
255 199 46
255 210 47
253 225 47
254 230 75
256 256 110
R G B


newN = 1:64;

isn = floor(linspace(1,64,36));
%RGB = [R G B];
R1 = RGB(:,1);
G1 = RGB(:,2);
B1 = RGB(:,3);

Rn = runmean(interp1(isn, R1, newN),2);
Gn = runmean(interp1(isn, G1, newN),2);
Bn = runmean(interp1(isn, B1, newN),2);

newC=  [Rn', Gn', Bn']./256;


close all
figure ;
plot(newN, Rn, 'r-')
hold on
plot(newN, Gn, 'G-')
plot(newN, Bn, 'b-')
colormap(newC);
colorbar('southoutside')
ylim([0 260])
xlim([1 64])
legend('R', 'G', 'B','Location','southoutside','Orientation','horizontal')
xlabel('C-index')
ylabel('R,G,B')
export_fig([ 'RGB-colormap'   ],'-jpeg','-r250')

figure;
plot(newN, sum(newC,2)./3, 'r-')
ylabel('Intensity')
xlabel('C-index')
xlim([1 64])
export_fig([ 'RGB-intensity' ],'-jpeg','-r250')

Here is an alternate
175 256 255
100 249 255
50 223 253
10 191 252
9 144 252
12 106 255
11 79 254
26 56 254
34 38 255
50 25 255
79 15 255
85 15 255
101 30 255
132 50 255
150 70 255
177 80 255
217 100 255
243 100 255
255 80 213
255 70 175
255 50 143
255 30 110
255 15 88
255 25 65
255 44 35
255 72 35
254 95 39
255 116 45
254 138 41
254 160 46
255 183 45
255 199 46
255 225 47
253 240 47
254 250 75
256 256 129
R G B

It adds whiteness in the middle, creating W shaped swing to the green pallets.


Wednesday, June 24, 2015

#matlab colormap rose

This colormap, rose, can capture the variations... still missing the cyan and yellow. But follows the intensity rule.
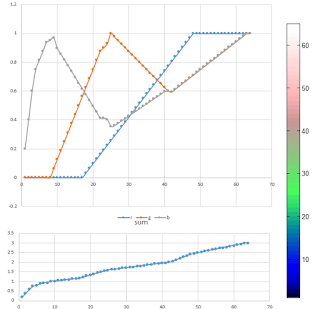
The rgb values bounce around after prominence. The sum of pix intensity is monotonously increasing. 
r g b sum
1 0 0 0.2 0.2
2 0 0 0.4 0.4
3 0 0 0.6 0.6
4 0 0 0.75 0.75
5 0 0 0.8125 0.8125
6 0 0 0.875 0.875
7 0 0 0.9375 0.9375
8 0 0 0.95 0.95
9 0 0.0625 0.97 1.0325
10 0 0.125 0.8972 1.0222
11 0 0.1875 0.8569 1.0444
12 0 0.25 0.8167 1.0667
13 0 0.3125 0.7764 1.0889
14 0 0.375 0.7361 1.1111
15 0 0.4375 0.6958 1.1333
16 0 0.5 0.6556 1.1556
17 0 0.5625 0.6153 1.1778
18 0.0323 0.625 0.575 1.2323
19 0.0645 0.6875 0.5347 1.2867
20 0.0968 0.75 0.4944 1.3412
21 0.129 0.8125 0.4542 1.3957
22 0.1613 0.875 0.4139 1.4502
23 0.1935 0.9 0.4111 1.5046
24 0.2258 0.93 0.4033 1.5591
25 0.2581 1 0.3556 1.6137
26 0.2903 0.975 0.36 1.6253
27 0.3226 0.95 0.3768 1.6494
28 0.3548 0.925 0.3937 1.6735
29 0.3871 0.9 0.4105 1.6976
30 0.4194 0.875 0.4274 1.7217
31 0.4516 0.85 0.4442 1.7458
32 0.4839 0.825 0.4611 1.7699
33 0.5161 0.8 0.4779 1.794
34 0.5484 0.775 0.4947 1.8181
35 0.5806 0.75 0.5116 1.8422
36 0.6129 0.725 0.5284 1.8663
37 0.6452 0.7 0.5453 1.8904
38 0.6774 0.675 0.5621 1.9145
39 0.7097 0.65 0.5789 1.9386
40 0.7419 0.625 0.5958 1.9627
41 0.7742 0.6 0.6 1.9742
42 0.8065 0.5935 0.5935 1.9935
43 0.8387 0.6129 0.6129 2.0645
44 0.871 0.6323 0.6323 2.1355
45 0.9032 0.6516 0.6516 2.2065
46 0.9355 0.671 0.671 2.2774
47 0.9677 0.6903 0.6903 2.3484
48 1 0.7097 0.7097 2.4194
49 1 0.729 0.729 2.4581
50 1 0.7484 0.7484 2.4968
51 1 0.7677 0.7677 2.5355
52 1 0.7871 0.7871 2.5742
53 1 0.8065 0.8065 2.6129
54 1 0.8258 0.8258 2.6516
55 1 0.8452 0.8452 2.6903
56 1 0.8645 0.8645 2.729
57 1 0.8839 0.8839 2.7677
58 1 0.9032 0.9032 2.8065
59 1 0.9226 0.9226 2.8452
60 1 0.9419 0.9419 2.8839
61 1 0.9613 0.9613 2.9226
62 1 0.9806 0.9806 2.9613
63 1 1 1 3
64 1 1 1 3

Tuesday, June 23, 2015

Colormap goofy #matlab

Well, this does not look as good as the rainbow, but does have the increasing intensity, and some degree of nice variation in rgb. I have previously proposed a new colormap "hotjet". However the nice colormap in "hotjet" did not have the increasing intensity.

It was a bit hard to come up with the numbers. So, I simply superimposed the green and blue colors modeled as the sine and cosine waves so that they complement each other. Meanwhile, I added a gradient to the red color from 10 to 54. That helped to increase the color intensity even though the sine and cosine were simply summed to 1.
Figure below shows the colorscheme for the RGB components. I had to fiddle the numbers on the first and last 10 bins because I wanted the "outliers" to have some respected colors.
Please allow me to call it goofy as it has green-goofy color at the center. I really miss the yellow and cyan from jet.

Components of Goofy. The liner trend in r helps increase the intensity.

r g b sum
1 0.000 0.000 0.200 0.200
2 0.000 0.000 0.400 0.400
3 0.000 0.000 0.600 0.600
4 0.000 0.000 0.750 0.750
5 0.000 0.000 0.813 0.813
6 0.000 0.000 0.850 0.850
7 0.000 0.000 0.938 0.938
8 0.000 0.000 0.950 0.950
9 0.000 0.000 0.980 0.980
10 0.022 0.000 1.000 1.022
11 0.044 0.070 0.930 1.044
12 0.067 0.139 0.861 1.067
13 0.089 0.208 0.792 1.089
14 0.111 0.276 0.724 1.111
15 0.133 0.342 0.658 1.133
16 0.156 0.407 0.593 1.156
17 0.178 0.469 0.531 1.178
18 0.200 0.530 0.470 1.200
19 0.222 0.588 0.412 1.222
20 0.244 0.643 0.357 1.244
21 0.267 0.695 0.305 1.267
22 0.289 0.743 0.257 1.289
23 0.311 0.788 0.212 1.311
24 0.333 0.829 0.171 1.333
25 0.356 0.866 0.134 1.356
26 0.378 0.899 0.101 1.378
27 0.400 0.927 0.073 1.400
28 0.422 0.951 0.049 1.422
29 0.444 0.970 0.030 1.444
30 0.467 0.985 0.015 1.467
31 0.489 0.995 0.005 1.489
32 0.511 0.999 0.001 1.511
33 0.533 0.999 0.001 1.533
34 0.556 0.995 0.005 1.556
35 0.578 0.985 0.015 1.578
36 0.600 0.970 0.030 1.600
37 0.622 0.951 0.049 1.622
38 0.644 0.927 0.073 1.644
39 0.667 0.899 0.101 1.667
40 0.689 0.866 0.134 1.689
41 0.711 0.829 0.171 1.711
42 0.733 0.788 0.212 1.733
43 0.756 0.743 0.257 1.756
44 0.778 0.695 0.305 1.778
45 0.800 0.643 0.357 1.800
46 0.822 0.588 0.412 1.822
47 0.844 0.530 0.470 1.844
48 0.867 0.469 0.531 1.867
49 0.889 0.407 0.593 1.889
50 0.911 0.342 0.658 1.911
51 0.933 0.276 0.724 1.933
52 0.956 0.208 0.792 1.956
53 0.978 0.139 0.861 1.978
54 1.000 0.070 0.930 2.000
55 1.000 0.130 0.960 2.090
56 1.000 0.200 0.970 2.170
57 1.000 0.300 0.980 2.280
58 1.000 0.400 0.900 2.300
59 1.000 0.500 0.813 2.313
60 1.000 0.600 0.850 2.450
61 1.000 0.700 0.938 2.638
62 1.000 0.800 0.950 2.750
63 1.000 0.900 0.980 2.880
64 1.000 1.000 1.000 3.000

Colormap: hotjet

The problem with jet is that the brightness intensity index (sum of rgb) decreases and is non monotonously increasing.

In order to overcome this, we can use parula or hot/bone colorscheme. However, they lack the contrast. So, I am trying to come up with a nice colormap which combines the strength of both: the spectrum of variability and the increasing brightness of the color. I propose hotjet. This uses the full strength of the color brightness from 0 to maximum of 3.

One thing to work: the middle region still is stuck at sum value of 2. This needs to be worked to get the gradual increase in the color intensity. Currently it is stagnant after row 24. This cause the brightness color be the same at the middle range. The color combination in there supply the variation. But not intensity yet.

0 0 0.2 0.2
0 0 0.4 0.4
0 0 0.6 0.6
0 0 0.75 0.75
0 0 0.8125 0.8125
0 0 0.875 0.875
0 0 0.9375 0.9375
0 0 1 1
0 0.0625 1 1.0625
0 0.125 1 1.125
0 0.1875 1 1.1875
0 0.25 1 1.25
0 0.3125 1 1.3125
0 0.375 1 1.375
0 0.4375 1 1.4375
0 0.5 1 1.5
0 0.5625 1 1.5625
0 0.625 1 1.625
0 0.6875 1 1.6875
0 0.75 1 1.75
0 0.8125 1 1.8125
0 0.875 1 1.875
0 0.9 1 1.9
0 0.93 1 1.93
0 1 1 2
0.125 1 0.875 2
0.1875 1 0.8125 2
0.25 1 0.75 2
0.3125 1 0.6875 2
0.375 1 0.625 2
0.4375 1 0.5625 2
0.5 1 0.5 2
0.5625 1 0.4375 2
0.625 1 0.375 2
0.6875 1 0.3125 2
0.75 1 0.25 2
0.8125 1 0.1875 2
0.875 1 0.125 2
0.9375 1 0.0625 2
1 1 0 2
1 0.9375 0.0625 2
1 0.875 0.125 2
1 0.8125 0.1875 2
1 0.75 0.25 2
1 0.6875 0.3125 2
1 0.625 0.375 2
1 0.5625 0.4375 2
1 0.5 0.5 2
1 0.4375 0.5625 2
1 0.375 0.625 2
1 0.3125 0.6875 2
1 0.25 0.75 2
1 0.1875 0.8125 2
1 0.125 0.875 2
1 0.1 0.9 2
1 0.1 0.92 2.02
0.9375 0.2 0.9 2.0375
0.9 0.3 0.85 2.05
0.86 0.3 0.9 2.06
1 0.3 0.77 2.07
1 0.3 0.8125 2.1125
1 0.6 0.875 2.475
1 0.9 0.9375 2.8375
1 1 1 3


0 0 0.2
0 0 0.4
0 0 0.6
0 0 0.75
0 0 0.8125
0 0 0.875
0 0 0.9375
0 0 1
0 0.0625 1
0 0.125 1
0 0.1875 1
0 0.25 1
0 0.3125 1
0 0.375 1
0 0.4375 1
0 0.5 1
0 0.5625 1
0 0.625 1
0 0.6875 1
0 0.75 1
0 0.8125 1
0 0.875 1
0 0.9 1
0 0.93 1
0 1 1
0.125 1 0.875
0.1875 1 0.8125
0.25 1 0.75
0.3125 1 0.6875
0.375 1 0.625
0.4375 1 0.5625
0.5 1 0.5
0.5625 1 0.4375
0.625 1 0.375
0.6875 1 0.3125
0.75 1 0.25
0.8125 1 0.1875
0.875 1 0.125
0.9375 1 0.0625
1 1 0
1 0.9375 0.0625
1 0.875 0.125
1 0.8125 0.1875
1 0.75 0.25
1 0.6875 0.3125
1 0.625 0.375
1 0.5625 0.4375
1 0.5 0.5
1 0.4375 0.5625
1 0.375 0.625
1 0.3125 0.6875
1 0.25 0.75
1 0.1875 0.8125
1 0.125 0.875
1 0.1 0.9
1 0.1 0.92
0.9375 0.2 0.9
0.9 0.3 0.85
0.86 0.3 0.9
1 0.3 0.77
1 0.3 0.8125
1 0.6 0.875
1 0.9 0.9375
1 1 1