Wednesday, January 28, 2015

Plot LST

fn = 'MOD11_L2.A2010001.1835.041.2010006193246.hdf' Longitude = double(hdfread(fn, 'Longitude')); Latitude = double(hdfread(fn, 'Latitude')); LST = double(hdfread(fn, 'LST')); % LST550 = squeeze(LST); % this is LST .550 um LST(LST<7500 an="" lst="">65535) = NaN; LST = 0.02* LST; % fill = -9999*scale % LST550(LST550==fill)=NaN; figure load coast latlim=[floor(min(min(Latitude))),ceil(max(max(Latitude))) ]; lonlim=[floor(min(min(Longitude))),ceil(max(max(Longitude))) ]; ax = worldmap(latlim, lonlim); surfacem(Latitude, Longitude, LST); geoshow(lat, long,'Color', 'black' ) colormap; set(gcf,'Color','white') map2 = colormap; map2( 1, : ) = 1; colormap(map2); colorbar % saveas(gcf, 'plotHDF.png', 'png') close all


 figure
W(W<0) = NaN;  
load coast
latlim=[floor(min(min(Lat))),ceil(max(max(Lat))) ]; lonlim=[floor(min(min(Lon))),ceil(max(max(Lon))) ];
ax = worldmap(latlim, lonlim);
surfacem(Lat, Lon, W);
geoshow(lat, long,'Color', 'black' )
colormap; set(gcf,'Color','white')
map2 = colormap; map2( 1, : ) = 1; colormap(map2);
colorbar % saveas(gcf, 'plotHDF.png', 'png') close all
caxis([ 0 5])
Tuesday, January 27, 2015

Variable Assignment in python

The deep copy versus the shallow copy example
# note the difference between a=b and a= b[:] a = [[1,2],[3,4]] b = a[:] #shallow copy b[1] = [4,5] print a,b ############## # now watch b=a b[1] = [4,5] print a,b # see the difference? Can you explain from this how the global objects are assigned in python? #This is a good excercise.

Thursday, January 22, 2015

Using jabref to import the .bib to microsoft word

Using the citation tool in word is not as easy as it is for the latex compilations. Reference tools are helpful, but can not beat tex.

I came across a way to import the .bib into word.

1. save the .bib reference source, open it with jabref. Check if the info is correct on the jabref.
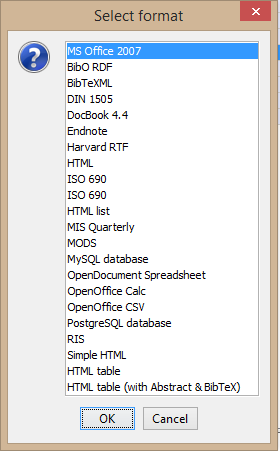
2. Right click on the selected entries and then Export to clipboard> then select the word format.
This essentially copies the xml information. copy a notepad++ editor and save it as bibliography_paper.xml
3. Go to the references (Word 2013) tab>> Manage Sources>> Browse>> select the xml file.
The list will be popped up, you can then select the desired ones/all in the list to move them into the current list (can be sorted by year/tag etc). Then close the dialog box.
4. After that simly insert citation from the "insert citation" button.
5. At the end of the work, simply insert bibliography.

Cheers!


Tuesday, January 13, 2015

Plotyy example #matlab #plot

A simple plotyy command for matlab to plot two data on y axis.
figure;
[ax,h1,h2] = plotyy(date,data1,date,data2);
% AX(2) = [];
set(h1,  'Markerfacecolor','k','Markersize',3)
set(h2, 'Markerfacecolor','b','Markersize',3)
% set(AX,'XAxisLocation','top', 'XTickLabel',[])
datetick('x',12,'keeplimits','keepticks')
set(ax(2),'XAxisLocation','bottom','XTickLabel',[]);
set(h1, 'Marker', 'o', 'LineStyle', 'none', 'MarkerSize', 3);
set(h2, 'Marker', '*', 'LineStyle', 'none', 'MarkerSize', 3);
title(tit);
ylabel(ax(1),'asdf(cm)') % left y-axis
ylabel(ax(2),'ttt') % right y-axis