Tuesday, December 29, 2015

Too many outputs requested. Most likely cause is missing []

This is one of the weirdest error I saw in matlab.
"Too many outputs requested. Most likely cause is missing [] around left hand side that has a comma separated list expansion."
In my case, this was caused by the following sequence of operations:
I was extracting name from a dir object. The dir returned an empty output. This caused the query in the for loop to return void. Obviously, "too many outputs requested" from a zero size variable.

Wednesday, September 30, 2015

Grab and Release the Mouse/Keyboard in NoMachine

I had an issue with NoMachine set up. The default key was alt+ctrl+left key or zero. But somehow it did not work.

I had a shortcut assigned to speaker volume by alt+ctrl+up arrow. This helped.

One solution is to uncheck the mouse and keyboard "grab" option in the setting.

Thursday, September 10, 2015

Plot Clouds as white pix

Plot Clouds
figure;
c95copy = double(c95)+1;
imagesc(c95copy);
icol = colormap;
icol(64,:) = [1 1 1];
colormap(icol)

Thursday, August 6, 2015

webmap plot in matlab example

Webmap in matlab is a good feature, but not well develop yet to stand next to ArcMap. Here is an example.

It lacks the compass, and nice printing feature (

webmap('Light Gray Canvas Map','WrapAround',false)
% nasa = wmsfind('nasa', 'SearchField', 'serverurl');
% baselayer = refine(nasa, 'bluemarbleng',  ...
%       'SearchField', 'layername', 'MatchType', 'exact');
% baselayer = wmsupdate(baselayer);
% webmap(baselayer)
% site
lat0  =32 ;
lon0 =-110;
radius = 15000;
az = [];
e = wgs84Ellipsoid;
[lat, lon] = scircle1(lat0, lon0, radius, az, e);
wmline(lat, lon, 'Color', 'red', 'OverlayName', 'SiteName ','Autofit',true) ;

wmprint is not so good.

Monday, July 27, 2015

For Imagesc, plot water/nan with different color

Figure plot with the lowest value set as distinct colormap.
 figure; imagesc(Temperature)

icol =  colormap;
icol(1,:) = [0 0 0]; % or 111 for white
colormap(icol);

Monday, July 20, 2015

isleapyear function matab

Is it a leapyear?
isleapyear = @(yr) (datenum(yr+1,1,1)-datenum(yr,1,1))==366;
isleapyear(1900)

Wednesday, June 24, 2015

#matlab colormap rose

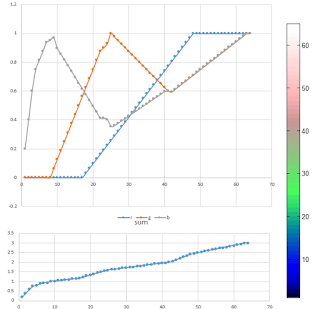
This colormap, rose, can capture the variations... still missing the cyan and yellow. But follows the intensity rule.
The rgb values bounce around after prominence. The sum of pix intensity is monotonously increasing. 
r g b sum
1 0 0 0.2 0.2
2 0 0 0.4 0.4
3 0 0 0.6 0.6
4 0 0 0.75 0.75
5 0 0 0.8125 0.8125
6 0 0 0.875 0.875
7 0 0 0.9375 0.9375
8 0 0 0.95 0.95
9 0 0.0625 0.97 1.0325
10 0 0.125 0.8972 1.0222
11 0 0.1875 0.8569 1.0444
12 0 0.25 0.8167 1.0667
13 0 0.3125 0.7764 1.0889
14 0 0.375 0.7361 1.1111
15 0 0.4375 0.6958 1.1333
16 0 0.5 0.6556 1.1556
17 0 0.5625 0.6153 1.1778
18 0.0323 0.625 0.575 1.2323
19 0.0645 0.6875 0.5347 1.2867
20 0.0968 0.75 0.4944 1.3412
21 0.129 0.8125 0.4542 1.3957
22 0.1613 0.875 0.4139 1.4502
23 0.1935 0.9 0.4111 1.5046
24 0.2258 0.93 0.4033 1.5591
25 0.2581 1 0.3556 1.6137
26 0.2903 0.975 0.36 1.6253
27 0.3226 0.95 0.3768 1.6494
28 0.3548 0.925 0.3937 1.6735
29 0.3871 0.9 0.4105 1.6976
30 0.4194 0.875 0.4274 1.7217
31 0.4516 0.85 0.4442 1.7458
32 0.4839 0.825 0.4611 1.7699
33 0.5161 0.8 0.4779 1.794
34 0.5484 0.775 0.4947 1.8181
35 0.5806 0.75 0.5116 1.8422
36 0.6129 0.725 0.5284 1.8663
37 0.6452 0.7 0.5453 1.8904
38 0.6774 0.675 0.5621 1.9145
39 0.7097 0.65 0.5789 1.9386
40 0.7419 0.625 0.5958 1.9627
41 0.7742 0.6 0.6 1.9742
42 0.8065 0.5935 0.5935 1.9935
43 0.8387 0.6129 0.6129 2.0645
44 0.871 0.6323 0.6323 2.1355
45 0.9032 0.6516 0.6516 2.2065
46 0.9355 0.671 0.671 2.2774
47 0.9677 0.6903 0.6903 2.3484
48 1 0.7097 0.7097 2.4194
49 1 0.729 0.729 2.4581
50 1 0.7484 0.7484 2.4968
51 1 0.7677 0.7677 2.5355
52 1 0.7871 0.7871 2.5742
53 1 0.8065 0.8065 2.6129
54 1 0.8258 0.8258 2.6516
55 1 0.8452 0.8452 2.6903
56 1 0.8645 0.8645 2.729
57 1 0.8839 0.8839 2.7677
58 1 0.9032 0.9032 2.8065
59 1 0.9226 0.9226 2.8452
60 1 0.9419 0.9419 2.8839
61 1 0.9613 0.9613 2.9226
62 1 0.9806 0.9806 2.9613
63 1 1 1 3
64 1 1 1 3

Tuesday, June 23, 2015

Colormap goofy #matlab

Well, this does not look as good as the rainbow, but does have the increasing intensity, and some degree of nice variation in rgb. I have previously proposed a new colormap "hotjet". However the nice colormap in "hotjet" did not have the increasing intensity.

It was a bit hard to come up with the numbers. So, I simply superimposed the green and blue colors modeled as the sine and cosine waves so that they complement each other. Meanwhile, I added a gradient to the red color from 10 to 54. That helped to increase the color intensity even though the sine and cosine were simply summed to 1.
Figure below shows the colorscheme for the RGB components. I had to fiddle the numbers on the first and last 10 bins because I wanted the "outliers" to have some respected colors.
Please allow me to call it goofy as it has green-goofy color at the center. I really miss the yellow and cyan from jet.

Components of Goofy. The liner trend in r helps increase the intensity.

r g b sum
1 0.000 0.000 0.200 0.200
2 0.000 0.000 0.400 0.400
3 0.000 0.000 0.600 0.600
4 0.000 0.000 0.750 0.750
5 0.000 0.000 0.813 0.813
6 0.000 0.000 0.850 0.850
7 0.000 0.000 0.938 0.938
8 0.000 0.000 0.950 0.950
9 0.000 0.000 0.980 0.980
10 0.022 0.000 1.000 1.022
11 0.044 0.070 0.930 1.044
12 0.067 0.139 0.861 1.067
13 0.089 0.208 0.792 1.089
14 0.111 0.276 0.724 1.111
15 0.133 0.342 0.658 1.133
16 0.156 0.407 0.593 1.156
17 0.178 0.469 0.531 1.178
18 0.200 0.530 0.470 1.200
19 0.222 0.588 0.412 1.222
20 0.244 0.643 0.357 1.244
21 0.267 0.695 0.305 1.267
22 0.289 0.743 0.257 1.289
23 0.311 0.788 0.212 1.311
24 0.333 0.829 0.171 1.333
25 0.356 0.866 0.134 1.356
26 0.378 0.899 0.101 1.378
27 0.400 0.927 0.073 1.400
28 0.422 0.951 0.049 1.422
29 0.444 0.970 0.030 1.444
30 0.467 0.985 0.015 1.467
31 0.489 0.995 0.005 1.489
32 0.511 0.999 0.001 1.511
33 0.533 0.999 0.001 1.533
34 0.556 0.995 0.005 1.556
35 0.578 0.985 0.015 1.578
36 0.600 0.970 0.030 1.600
37 0.622 0.951 0.049 1.622
38 0.644 0.927 0.073 1.644
39 0.667 0.899 0.101 1.667
40 0.689 0.866 0.134 1.689
41 0.711 0.829 0.171 1.711
42 0.733 0.788 0.212 1.733
43 0.756 0.743 0.257 1.756
44 0.778 0.695 0.305 1.778
45 0.800 0.643 0.357 1.800
46 0.822 0.588 0.412 1.822
47 0.844 0.530 0.470 1.844
48 0.867 0.469 0.531 1.867
49 0.889 0.407 0.593 1.889
50 0.911 0.342 0.658 1.911
51 0.933 0.276 0.724 1.933
52 0.956 0.208 0.792 1.956
53 0.978 0.139 0.861 1.978
54 1.000 0.070 0.930 2.000
55 1.000 0.130 0.960 2.090
56 1.000 0.200 0.970 2.170
57 1.000 0.300 0.980 2.280
58 1.000 0.400 0.900 2.300
59 1.000 0.500 0.813 2.313
60 1.000 0.600 0.850 2.450
61 1.000 0.700 0.938 2.638
62 1.000 0.800 0.950 2.750
63 1.000 0.900 0.980 2.880
64 1.000 1.000 1.000 3.000

Colormap: hotjet

The problem with jet is that the brightness intensity index (sum of rgb) decreases and is non monotonously increasing.

In order to overcome this, we can use parula or hot/bone colorscheme. However, they lack the contrast. So, I am trying to come up with a nice colormap which combines the strength of both: the spectrum of variability and the increasing brightness of the color. I propose hotjet. This uses the full strength of the color brightness from 0 to maximum of 3.

One thing to work: the middle region still is stuck at sum value of 2. This needs to be worked to get the gradual increase in the color intensity. Currently it is stagnant after row 24. This cause the brightness color be the same at the middle range. The color combination in there supply the variation. But not intensity yet.

0 0 0.2 0.2
0 0 0.4 0.4
0 0 0.6 0.6
0 0 0.75 0.75
0 0 0.8125 0.8125
0 0 0.875 0.875
0 0 0.9375 0.9375
0 0 1 1
0 0.0625 1 1.0625
0 0.125 1 1.125
0 0.1875 1 1.1875
0 0.25 1 1.25
0 0.3125 1 1.3125
0 0.375 1 1.375
0 0.4375 1 1.4375
0 0.5 1 1.5
0 0.5625 1 1.5625
0 0.625 1 1.625
0 0.6875 1 1.6875
0 0.75 1 1.75
0 0.8125 1 1.8125
0 0.875 1 1.875
0 0.9 1 1.9
0 0.93 1 1.93
0 1 1 2
0.125 1 0.875 2
0.1875 1 0.8125 2
0.25 1 0.75 2
0.3125 1 0.6875 2
0.375 1 0.625 2
0.4375 1 0.5625 2
0.5 1 0.5 2
0.5625 1 0.4375 2
0.625 1 0.375 2
0.6875 1 0.3125 2
0.75 1 0.25 2
0.8125 1 0.1875 2
0.875 1 0.125 2
0.9375 1 0.0625 2
1 1 0 2
1 0.9375 0.0625 2
1 0.875 0.125 2
1 0.8125 0.1875 2
1 0.75 0.25 2
1 0.6875 0.3125 2
1 0.625 0.375 2
1 0.5625 0.4375 2
1 0.5 0.5 2
1 0.4375 0.5625 2
1 0.375 0.625 2
1 0.3125 0.6875 2
1 0.25 0.75 2
1 0.1875 0.8125 2
1 0.125 0.875 2
1 0.1 0.9 2
1 0.1 0.92 2.02
0.9375 0.2 0.9 2.0375
0.9 0.3 0.85 2.05
0.86 0.3 0.9 2.06
1 0.3 0.77 2.07
1 0.3 0.8125 2.1125
1 0.6 0.875 2.475
1 0.9 0.9375 2.8375
1 1 1 3


0 0 0.2
0 0 0.4
0 0 0.6
0 0 0.75
0 0 0.8125
0 0 0.875
0 0 0.9375
0 0 1
0 0.0625 1
0 0.125 1
0 0.1875 1
0 0.25 1
0 0.3125 1
0 0.375 1
0 0.4375 1
0 0.5 1
0 0.5625 1
0 0.625 1
0 0.6875 1
0 0.75 1
0 0.8125 1
0 0.875 1
0 0.9 1
0 0.93 1
0 1 1
0.125 1 0.875
0.1875 1 0.8125
0.25 1 0.75
0.3125 1 0.6875
0.375 1 0.625
0.4375 1 0.5625
0.5 1 0.5
0.5625 1 0.4375
0.625 1 0.375
0.6875 1 0.3125
0.75 1 0.25
0.8125 1 0.1875
0.875 1 0.125
0.9375 1 0.0625
1 1 0
1 0.9375 0.0625
1 0.875 0.125
1 0.8125 0.1875
1 0.75 0.25
1 0.6875 0.3125
1 0.625 0.375
1 0.5625 0.4375
1 0.5 0.5
1 0.4375 0.5625
1 0.375 0.625
1 0.3125 0.6875
1 0.25 0.75
1 0.1875 0.8125
1 0.125 0.875
1 0.1 0.9
1 0.1 0.92
0.9375 0.2 0.9
0.9 0.3 0.85
0.86 0.3 0.9
1 0.3 0.77
1 0.3 0.8125
1 0.6 0.875
1 0.9 0.9375
1 1 1